Social Distancing: Data Models for a Model Response to an Outbreak
Q&A with Peter Song
Professor of Biostatistics
What can your statistical models tell us about the growth of COVID-19 infections in the United States?
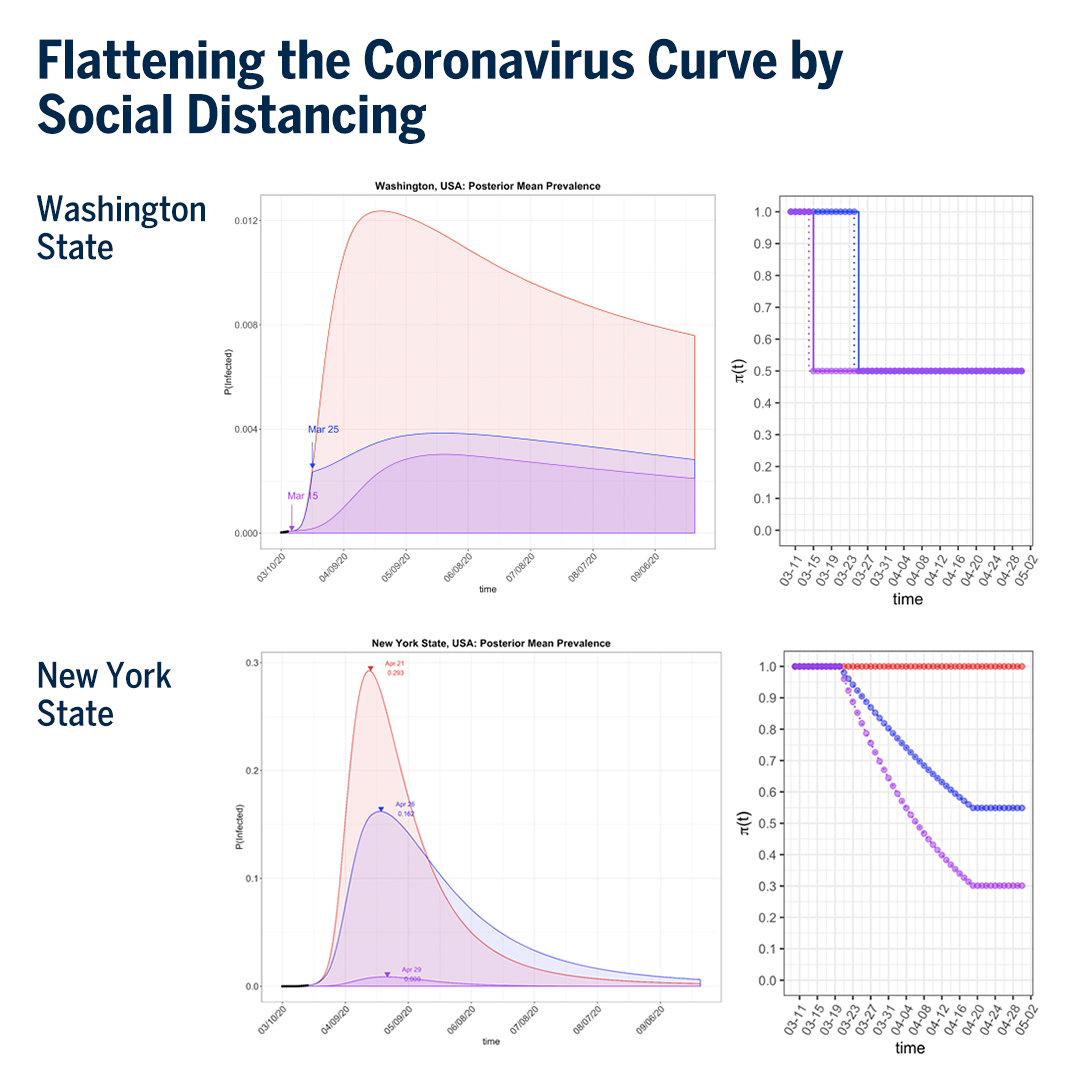
The model we developed assesses the effectiveness of preventive measures like social distancing and fast detection of infected cases so that we can come up with a right strategy or policy to flatten the coronavirus curve. We need precise quantification of this flattening effect to know when and how we must be prepared with our resources to battle this disease. We have seen very basic representations of this flattening concept in the media—how we can move infected cases out over more time to make that red mountain into a blue hill.
Our model is trying to help make these predictions so health care facilities and personnel can be better prepared. When our health system is well prepared, the mortality rate of COVID-19 may be minimized.
But how do you provide a more precise quantification of this phenomenon in the US for number of infected cases, number of hospitals, and even number of masks, protective gowns, and medical devices such as ventilators? How can we know when we need those things in which location? We need very precise numbers predicting these needs one or two weeks from now, a month from now, and so on. Our model is trying to help make these predictions so health care facilities and personnel can be better prepared. When our health system is well prepared, the mortality rate of COVID-19 may be minimized.
Are you able to look at the effect of different interventions, the difference between a place that has implemented strict social distancing compared to a location that has less strict measures?
In our model, we have a component that allows you to compare different levels of intervention measures. We’ve looked specifically at dramatic government-led preventive measures—closing bars and restaurants, restricting the number of people in public areas and in social gatherings, and so on. And our model can also evaluate the effectiveness of social distancing by incorporating the proportion of individuals demonstrating awareness of the “stay home” guidelines, practicing proper hand sanitation protocols, complying with self-isolation if needed, and taking responsibility for self-quarantine for those receiving a positive test for the virus. This gives us an overall statistical point of view on the proportion of people who have an awareness of their responsibility to protect themselves and others and whose behavior demonstrates that understanding.
When it comes to social distancing, what have you seen when comparing different areas that are doing different levels of it?
This is a difficult question to answer, because it is difficult to quantify precisely the type and strengths of these preventive measures across different areas. Our model provides a high-level view of what might happen if you do or do not follow these behavioral guidelines and to what degree you and the people around you are following them.
This is really the government’s job to issue policies that restrict social contact and then assess that the policy achieved the goal of reducing the infection curve.
The next step is to measure the impact of government-led interventions. Our analysis shows that you need about a 50 percent reduction of coronavirus transmission in a population to stretch the mass of infections out over enough time for health care systems to keep up. But how do you do that? This is really the government’s job to issue policies that restrict social contact and then assess that the policy achieved the goal of reducing the infection curve.
Have you compared particular intervention strategies that have been used already in the US?
Yes, we have. And our software can be downloaded by the public, so you can take a look at our model and analyze the data yourself.
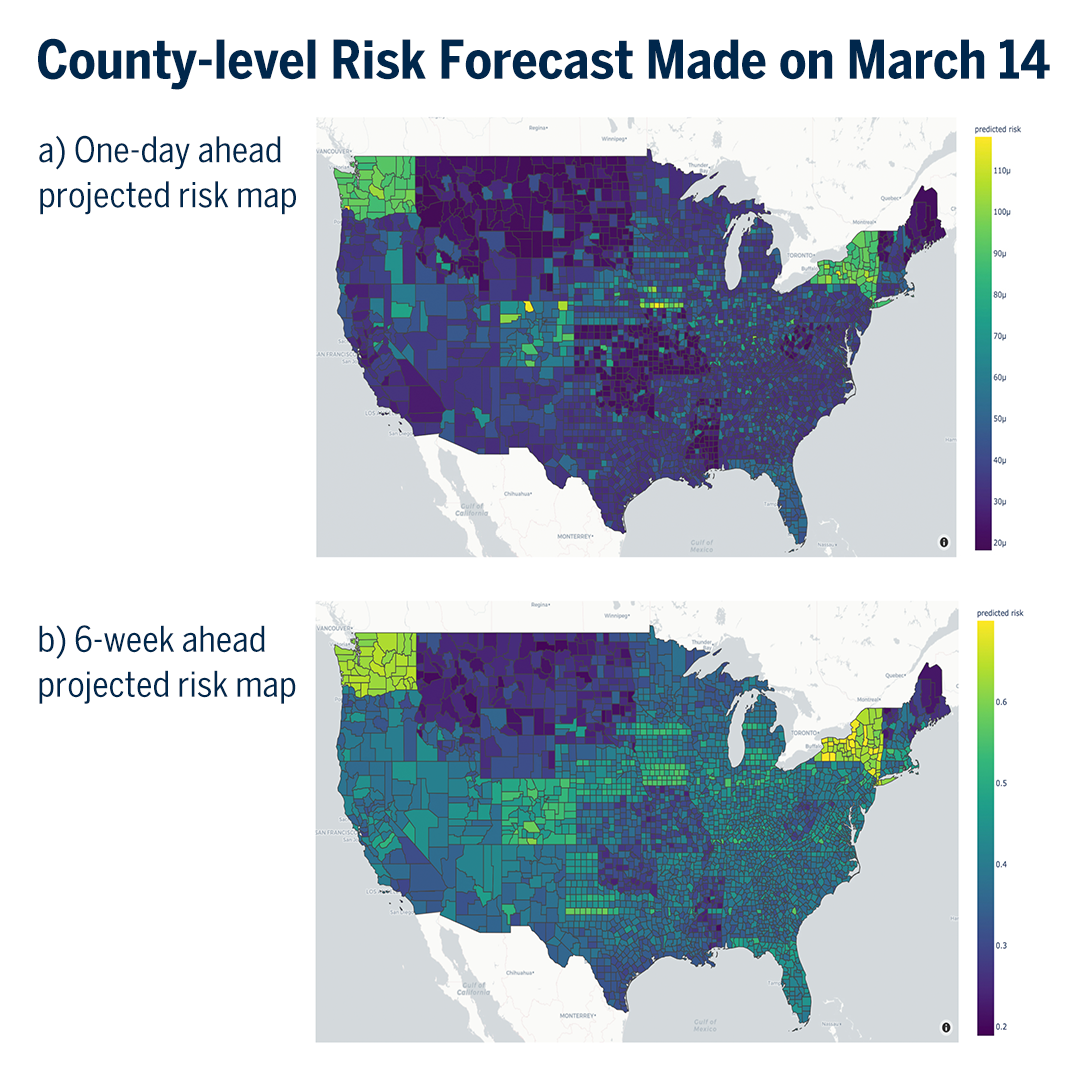
The ability to compare national responses to the public health crisis and assess risk could be extremely valuable to the federal government to adjust policies over time as the pandemic evolves.
The key issue in a comparative study of intervention strategies is the quality of available data. We are combining data from the University of Michigan and data culled from published data and from open sources on the internet. Institutions with larger data sets, such as the Centers for Disease Control and Prevention (CDC), could use our model to compare intervention effects between two states in the US or between two countries. The ability to compare national responses to the public health crisis and assess risk could be extremely valuable to the federal government to adjust policies over time as the pandemic evolves.
How does Google Maps connect with all of this?
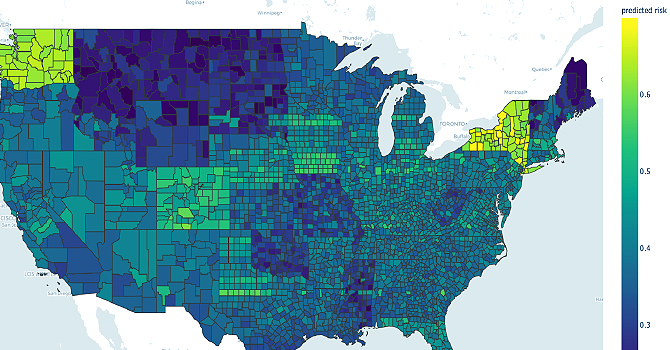
We’re aligning all of this data about the outbreak with Google Maps to provide what is likely to be a valuable public service as people begin to return to work and personal routines that involve travel.
We are planning to develop a mobile device app that will inform people about personal risk. A commuter or traveler could put an upcoming trip into the map and see what locations they’d be engaging, what is happening with the coronavirus outbreak in those contact points, and what their chances are of being exposed to the virus on this trip. Essentially, they would receive an overall risk score for their upcoming travel that they could also combine with their personal health data and other considerations to make a more informed choice for themselves and their community.
How can all of us learn and adapt our habits using the models you are working on?
We are working rather aggressively to disseminate this information. From epidemic-level disease outbreaks throughout human history—from the Black Death to the 1918 Influenza pandemic to the 2003 SARS outbreak—we know that social distancing is an effective way of mitigating the spread of severe infections.
From epidemic-level disease outbreaks throughout human history, we know that social distancing is an effective way of mitigating the spread of severe infections. We can do it this time, but everybody has to take responsibility for their own social distancing.
And we can do it this time, but everybody has to take responsibility for their own social distancing. Particularly with this disease, we all have a responsibility to protect the elderly. Until we have medications and vaccination, we don’t have other choices—social distancing is our path to slowing the spread of coronavirus. We have to think about our resources, whether our hospitals could handle a sudden increase in the number of infections.
It is frustrating to live this way for what could be a longer period of time for the epidemic in the US. Hopefully, we will all do our best at social distancing as we await medication and hopefully a vaccine—both of which take time to develop and test. Until then, we should take seriously our responsibility to slow down this outbreak.
Did you have a feeling right away that this was going to be a big deal?
Yes, for sure. Modeling is very important in a situation with a new disease where we have so many unknowns and have had so little time to study in depth this virus and the disease it causes. Because of that, the data we have and our proven statistical models help us look at the data and have some idea of what will happen in the next month, two months, over the summer. Will this end in the fall? Will COVID-19 flare back up when social distancing ends, when the weather changes, when children return to school
Modeling is very important in a situation with a new disease where we have so many unknowns and have had so little time to study in depth this virus and the disease it causes.
People are not just curious about what will happen six months from now. We have real decisions to make now in preparation for those coming months—how to manage medical staff, how many supplies to order, how and when to engage in certain economic activities, how and when to return to regular social behaviors, and so on.
Our model helps us begin to sort out possible answers to those questions. It does not predict the future with high certainty but it uses proven statistical methods to account for the uncertainty of the situation. Uncertainty is a blessing so we can be better prepared for the worst. It helps us look at all or many of the possible situations as we move forward. Our model doesn’t recommend a certain course of action. Instead, it helps government leaders and other decision makers work through potential turning points in the course of this disease and its impact on our society so that we can think through the range of turning points through time and hopefully make rational decisions that ensure more health for more people.
Has anyone been able yet to use your models to have a direct impact on government decision making?
Yes, there is a wonderful story from India, which so far has been a remarkable success story in the fight against COVID-19. India is the world’s largest democracy, with a population of over 1.3 billion—compare this to China at nearly 1.4 billion and the US at nearly 326 million. India has been vigilant in instituting the right public health interventions at the right time: sealing borders, canceling travel, closing schools, following up diligently with suspected cases of exposure, and enforcing adherence to quarantine recommendations.
My colleague Bhramar Mukherjee—chair and professor of Biostatistics—and her research group used our model to provide forecasts of how COVID-19 might spread in India. Their predictions were quoted in mainstream Indian media, and their medium.com article and extensive reporting may have contributed to the knowledge informing the historic decision by the Indian government to institute a 21-day nationwide lockdown starting March 25. This is an incredible story of how a data model can make a significant impact on public health policy making and, we hope, ultimately save lives from the COVID-19 outbreak in the world’s largest democracy.
- Read more about the COVID-19 outbreak and how public health experts are addressing this historic epidemic.
- Read more news articles about Biostatistics faculty, students, and alumni.
- Support research at Michigan Public Health.