Millions of Hours of Sound Exposure - October 28, 2020
Explore >70 million hours of environmental sound and headphone listening levels measured across the US
The Apple Hearing Study has already collected the largest-ever dataset of environmental sound and headphone listening levels – but we’re not done! We continue to measure these levels, along with hearing tests and heart rate information, to better understand the impacts of environmental sound and headphone listening on Americans’ hearing and cardiovascular health.
Our study’s main purpose is to better understand exposures to music and environmental sound across the nation, and to understand how these exposures relate to various health outcomes. The environmental sound and headphone listening data we have collected represent a critical step forward for our research.
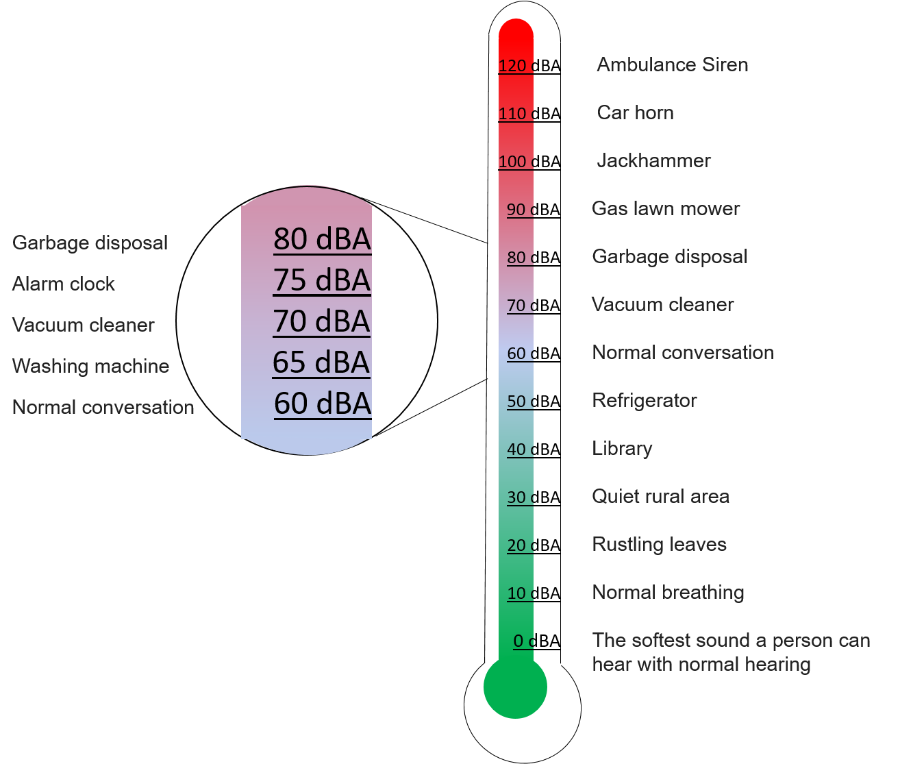
The noise "thermometer" below shows sound levels (in decibels, dBA) associated with some common sound sources. The sound levels that we have measured primarily are in the range of 60-80 dBA and therefore highlighted in the zoomed bubble.
Environmental Sound Levels
Using our study data, we have been able to generate a map of average environmental sound levels for each state across the US. This has never been done before using de-identified personal sound exposure data. As of September 1st, 2020, we have measured 71,666,949 hours of environmental sound levels! Among the participants who chose to contribute environmental sound data, the daily 8-hour average exposure (Lex8h) was 71.9 A-weighted decibels (dBA). For comparison, that is roughly as loud as a vacuum cleaner when it is running.
The video below shows how weekly average environmental sound levels at the state-level change each week from January 1st, 2020 to September 1st, 2020 among participants in the Apple Hearing Study. Lower sound levels on the scale are represented by very light blue while higher sound levels are darker blue. The weekly averages across this timeframe vary by state but generally get much quieter nationwide following orders related to the COVID-19 pandemic.
Nationwide weekly average environmental sound levels dropped in March, April, and May due to restrictions as a result of the COVID-19 pandemic. Otherwise nationwide average environmental sound levels are relatively consistent with a narrow range, as shown in the table below.
Nationwide Weekly Average Environmental Sound Levels (dBA)
| Note: This table shows nationwide averages while the map above shows statewide averages. | ||||
| MONTH | MEAN | MINIMUM | MAXIMUM | RANGE |
|---|---|---|---|---|
| January | 72.4 | 72.1 | 72.6 | 0.4 |
| February | 72.6 | 72.5 | 72.8 | 0.3 |
| March | 71.4 | 70.5 | 72.8 | 2.3 |
| April | 70.8 | 70.6 | 71.3 | 0.7 |
| May | 71.6 | 71.2 | 71.9 | 0.7 |
| June | 72.2 | 72.0 | 72.2 | 0.2 |
| July | 72.2 | 72.1 | 72.4 | 0.3 |
| August | 72.1 | 72.0 | 72.3 | 0.3 |
Nationwide environmental sound level averages are typically different between weekends and weekdays. However, during the initial stay-at-home orders due to COVID-19, this difference was reduced with weekends beginning to look more similar to weekdays.
Nationwide Environment Sound Levels (dBA) by Day of Week
| Month | Monday | Tuesday | Wednesday | Thursday | Friday | Saturday | Sunday |
|---|---|---|---|---|---|---|---|
| January | 71.7 | 71.9 | 72.1 | 72.1 | 72.9 | 73.3 | 72.4 |
| February | 71.9 | 72.1 | 72.2 | 72.4 | 73.2 | 73.8 | 72.8 |
| March | 71.0 | 71.1 | 71.4 | 71.5 | 71.9 | 72.0 | 71.6 |
| April | 70.5 | 70.6 | 70.5 | 70.5 | 70.8 | 71.4 | 70.8 |
| May | 71.0 | 71.1 | 71.2 | 71.4 | 71.8 | 72.6 | 71.9 |
| June | 71.5 | 71.7 | 71.8 | 71.9 | 72.5 | 73.1 | 72.5 |
| July | 71.7 | 71.8 | 71.8 | 72.1 | 72.6 | 73.4 | 72.4 |
| August | 71.6 | 71.8 | 71.9 | 71.9 | 72.5 | 73.1 | 72.4 |
The below video shows how daily average environmental sound levels changed each week over the course of the timeframe studied.
Headphone Listening Levels
As of September 1st, 2020, we have measured 5,738,357 hours of headphone listening levels! Among the participants who contribute to headphone listening levels data, the daily 8-hour average exposure (Lex8h) was 61.6 dBA, or just slightly louder than a normal conversation.
The video below shows how weekly average headphone listening levels at the state-level change each week from January 1st, 2020 to September 1st, 2020 among participants in the Apple Hearing Study. Lower sound levels on the scale are represented by very light blue while higher sound levels are darker blue. The weekly averages across this timeframe vary by state but generally get much quieter nationwide following orders related to the COVID-19 pandemic.
Nationwide weekly average headphone listening levels dropped in March, April, and May due to behavioral changes as a result of restrictions put in place to curb the COVID-19 pandemic and so far have not fully recovered to their pre-COVID-19 levels as shown in the table below.
Nationwide Daily Average Headphone Listening Levels (dBA)
| Note: This table shows nationwide averages while the map above shows statewide averages. | ||||
| MONTH | MEAN | MINIMUM | MAXIMUM | RANGE |
|---|---|---|---|---|
| January | 64.4 | 64.0 | 64.6 | 0.7 |
| February | 64.2 | 64.1 | 64.4 | 0.3 |
| March | 62.2 | 59.9 | 64.2 | 4.3 |
| April | 59.6 | 59.4 | 60.0 | 0.6 |
| May | 59.4 | 59.1 | 59.5 | 0.4 |
| June | 59.9 | 59.5 | 60.5 | 1.0 |
| July | 61.1 | 60.8 | 61.3 | 0.5 |
| August | 61.6 | 61.5 | 61.7 | 0.2 |
Nationwide headphone listening level averages are rather consistent across the entire week. Headphone listening behavior seems less variable than environmental sound level exposure. However, during the initial stay-at-home orders due to COVID-19 overall levels were reduced across the week.
Nationwide Headphone Listening Levels (dBA) by Day of Week
| Month | Monday | Tuesday | Wednesday | Thursday | Friday | Saturday | Sunday |
|---|---|---|---|---|---|---|---|
| January | 64.4 | 64.6 | 64.3 | 64.6 | 64.8 | 64.5 | 63.3 |
| February | 64.4 | 64.5 | 64.4 | 64.4 | 64.6 | 64.5 | 63.4 |
| March | 62.1 | 62.1 | 62.5 | 62.5 | 62.5 | 62.8 | 62.1 |
| April | 59.2 | 59.4 | 59.4 | 59.4 | 59.6 | 60.5 | 59.6 |
| May | 59.0 | 59.0 | 59.2 | 59.4 | 59.8 | 60.7 | 59.4 |
| June | 59.3 | 59.5 | 59.6 | 59.8 | 60.1 | 60.7 | 59.9 |
| July | 60.6 | 60.8 | 60.7 | 60.9 | 61.4 | 61.9 | 61.0 |
| August | 61.1 | 61.2 | 61.3 | 61.4 | 61.8 | 62.4 | 61.6 |
The below video shows how daily average headphone listening levels changed each week over the course of the timeframe studied.
We want to thank all of our current and future participants for contributing to our study, and continuing to help us ask and explore previously unanswerable questions.
If you are not currently participating in the study, please consider joining to help us develop even more insights into how Americans are exposed to sound!