What Makes a “Wave” of Disease? An Epidemiologist Explains
Abram L. Wagner
Research Assistant Professor of Epidemiology`
This article was originally posted on The Conversation.
![]()
Panic about a second wave of coronavirus cases is “overblown,” Vice President Mike Pence wrote in June, implying the US has COVID-19 under control. On the other hand, Anthony Fauci, director of the National Institute of Allergy and Infectious Diseases, warns that the US is still firmly within a first wave of cases.
As media broadcast information about daily increases in the number of cases, it’s hard not to wonder which way the country is headed. Have the weeks and months of lockdown really helped? What do the trends in diagnoses and deaths mean for the course of the pandemic? Is the US stuck in a first wave? Through the worst of it? Headed for a second round?
The word “wave” implies a natural pattern of peaks and valleys. It hints that even during a lull, future outbreaks of disease are possible.
Six months into the pandemic, people are looking for ways to make sense of what’s happening. Talking about waves of disease, with the implication of predictable rises and falls, is part of that. As an epidemiologist, I know that disease waves aren’t scientifically defined. But looking to the history of previous epidemics and other countries’ current COVID-19 outbreaks can be useful.
Characterizing a Wave
There’s no strict definition for what is or is not an epidemic wave or phase. A wave implies a rising number of sick individuals, a defined peak, and then a decline. The word “wave” implies a natural pattern of peaks and valleys. It hints that even during a lull, future outbreaks of disease are possible.
Historical outbreaks of infectious diseases offer some models for how the course of a disease like COVID-19 might unfold over time.
Some diseases come in somewhat predictable seasonal waves, with higher transmission rates at some times of the year than at others. Seasonal coronaviruses, like 229E or HKU1, which cause the common cold, have a high point from around December through March, according to research in the US and elsewhere.
Several factors influence whether a particular disease is seasonal in nature. Some pathogens may spread less well with greater humidity. Annual epidemics, like of influenza, may occur because of climate or patterns of social mixing—often driven by the school year or people staying inside more during the winter.
It’s possible that SARS-CoV-2—the coronavirus that causes COVID-19—spreads more efficiently under certain weather conditions. But recent outbreaks in Florida, Arizona, Texas, and Southern California suggest that warm or humid weather is not sufficient to stop the spread of the disease. Some scientists model that SARS-CoV-2 will eventually become seasonal like other coronaviruses.
The US is nowhere near what epidemiologists call herd immunity in the general population.
Waves and seasonal dynamics are also affected by levels of immunity in the human population. As more individuals become immune to a pathogen, its spread slows and eventually stops as the virus runs out of new people to infect. The US is nowhere near what epidemiologists call herd immunity in the general population. However, mathematical modelers suggest at least between 43 and 60 percent of people would need to be immune to SARS-CoV-2 for that to be the case.
Ebb and Flow, 150 Years of Influenza Waves
Some of the current talk of coronavirus waves likely stems from comparisons with past epidemics that did show these peaks and troughs of infections.
University of Oxford scholars of evidence-based medicine Tom Jefferson and Carl Heneghan have summarized past waves in respiratory virus pandemics over the previous 150 years. For example, the 1889-92 influenza outbreak had three distinct waves, which differed in their virulence. The second wave was much more severe, particularly in younger adults.
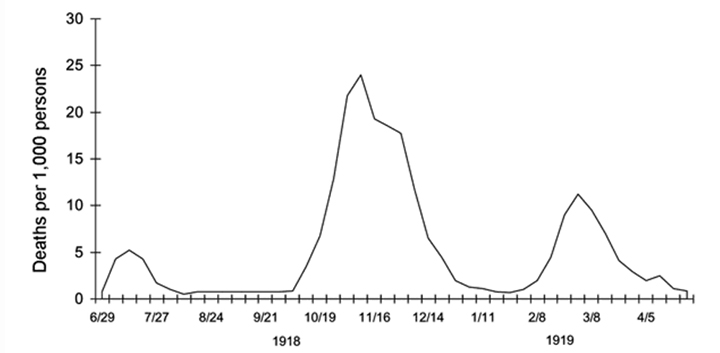
Three waves of death: weekly combined influenza and pneumonia mortality, United Kingdom, 1918–1919. The waves were broadly the same globally during the pandemic. Source: Taubenberger and Morens, "1918 Influenza: The Mother of All Pandemics," 2006.
The current COVID-19 pandemic is often compared to the 1918 H1N1 influenza pandemic, which had three distinct waves over the course of a year. The proportion of influenza patients who were severely ill or died was much higher in the last two waves compared to the first. It’s unclear whether being infected earlier on protected individuals during later waves.
More recently, the 2009 H1N1 influenza pandemic, though mild, had two distinct waves. This virus still commonly shows up in seasonal influenza outbreaks. A study of H1N1 influenza in 2009-2010 found that the second wave affected more older people, with underlying conditions.
Insight from the past suggests that discrete waves result as a disease spreads into and out of a population.
Insight from the past suggests that discrete waves result as a disease spreads into and out of a population. Different waves can have different features, too, regarding factors like disease severity or which populations are most affected.
What’s Happening Now in the US
Confirmed SARS-CoV-2 infections in the US are on the rise. Some of this increase may be driven by more widespread testing now. But the increases felt in many large states—Texas, California, Florida—are a result of more community transmission.
Currently, even with an increase in the number of cases in many parts of the US, there has not been a corresponding increase in the number of deaths.
The story from Iran may offer a cautionary note. From a peak of over 3,000 cases confirmed per day in early April, it declined to less than 1,000 by May, from which it has climbed to hover around 2,500 daily confirmed cases as of the end of June. The rise in the number of deaths did not occur until the second half of June. This is likely due to the time lag between when someone is infected and when they die.
The US is not yet in a second wave.
Accordingly, US states currently experiencing an uptick in COVID-19 confirmed cases could see a notable increase in deaths within a few weeks. The average age of those infected is getting younger, though, complicating predictions about a death toll.
The US is not yet in a second wave. And increasingly it looks like the country may not see one. Instead, the US may sustain a constant first wave that just continues to crest. The political willpower necessary to limit transmission through robust, ongoing lockdown measures seems, unfortunately, to have been snuffed out.
But arguing about whether the US is in a second wave, the first wave, or wave 1.5 ultimately doesn’t matter. Whichever it is, the commonsense actions everyone can currently take to limit the spread of infection remain the same—staying home when possible, wearing a mask and socially distancing when out, and frequently washing hands—will help speed our way beyond this pandemic, regardless of what wave we’re in.
About the Author
 Abram Wagner is Research Assistant Professor of Epidemiology at the University of
Michigan School of Public Health. He studies the predictors of vaccine-preventable
disease incidence, with a particular focus on vaccine hesitancy. Since 2000, the US
has licensed ten new vaccines and, at the same time, seen the emergence of widespread
vaccine hesitancy leading to outbreaks of measles and pertussis. Wagner’s research
focuses on developing evidence-based programs and policies that help control a broad
range of vaccine-preventable diseases.
Abram Wagner is Research Assistant Professor of Epidemiology at the University of
Michigan School of Public Health. He studies the predictors of vaccine-preventable
disease incidence, with a particular focus on vaccine hesitancy. Since 2000, the US
has licensed ten new vaccines and, at the same time, seen the emergence of widespread
vaccine hesitancy leading to outbreaks of measles and pertussis. Wagner’s research
focuses on developing evidence-based programs and policies that help control a broad
range of vaccine-preventable diseases.
- Interested in public health? Learn more today.
- Read more articles by Michigan Public Health students, faculty, staff, and alumni.
- Listen to the Public Health Surveillance: Immunity, Testing, and Contact Tracing podcast episode featuring Abram Wagner.
- Support research at Michigan Public Health.