Lifestyle risk factors for urban and rural participants with cancer

Jean Rinkowski
Master’s Student, Online MPH in Population and Health Sciences
 This article was originally published in the California Teachers Study blog.
Jean Rinkowski, a dedicated Physical Therapist and current Master of Public Health (MPH) student at the University of Michigan, has long been motivated by the healthcare disparities she's witnessed firsthand. She recently completed her Applied Practicum Experience (APEx) capstone project in collaboration with the California Teachers Study (CTS) cohort. The APEx project is an effort in which students work with community organizations to support real public health work.
Rinkowski was one of a handful of online MPH students chosen to work with CTS to explore a variety of research questions using the study's large data set. Her research set out to examine how lifestyle and other risk factors differ between urban and rural cancer patients, and hopefully, uncover potential areas for public health intervention. In this blog, she details her methodology, key findings, and the significant implications of her research on understanding and addressing health disparities.
The goal of my research project was to examine how lifestyle and other risk factors differed between urban and rural cancer patients in the California Teachers Study (CTS) cohort. Lifestyle risk factors are behaviors or habits that affect our health and can be modified or changed.
My project had three steps. First, I identified the ten most common cancers in the CTS. Next, I compared the lifestyle factors of participants who lived in urban areas at the time of their diagnosis with the lifestyle factors of participants who lived in rural areas at the time of their diagnosis. Finally, I analyzed each risk factor to determine if there was a statistical difference between urban and rural residents for any of the ten most common cancers. A statistically significant difference means it is unlikely that the differences we are seeing are due to chance.
My project looked at following risk factors:
- age at cancer diagnosis
- age at first pregnancy
- alcohol consumption
- body mass index (BMI)
- diet (both with and without alcohol)
- physical activity
- parity at baseline (whether the participant had given birth to any children when they joined the study)
- socioeconomic status (SES)
- total number of pregnancies
What I Found
The chart below shows the ten most common cancers in the CTS. Breast cancer is the most common cancer: almost 40% of all cancers were breast cancer. The second most common cancer is melanoma.
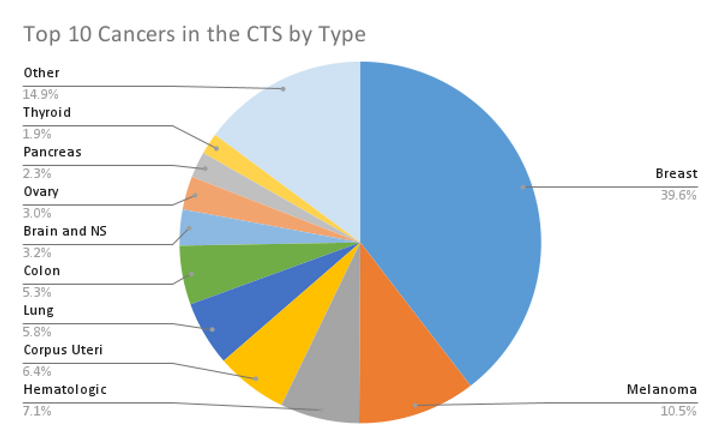
Figure 1: Top 10 Cancers in the CTS by Type pie chart
When I compared the lifestyle factors for urban and rural participants for each of these cancers, I found that lifestyle factors did vary for certain cancer types.
The table below shows the cancer types and the risk factors I evaluated. If there is a check mark, that means there were statistically significant differences between urban and rural participants for that particular risk factor and cancer type. For example, age at diagnosis was statistically different between urban and rural participants with melanoma, but not for any of the other cancer types I examined.
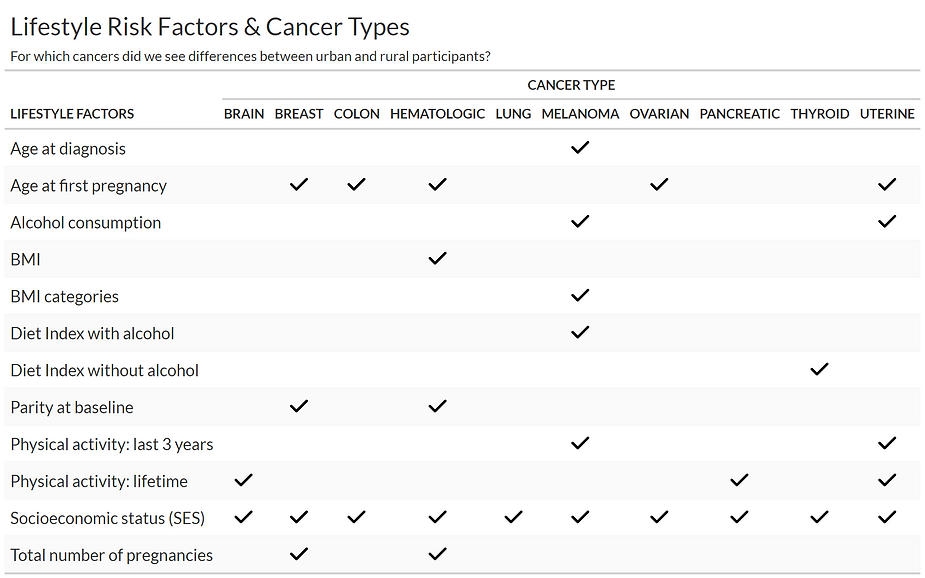
Figure 2: Lifestyle risk factors & cancer types table
There was only one factor that showed significance for every single cancer type: socioeconomic status (SES). We measured SES by creating a SES quartile variable. This variable consists of four groups (quartiles), where quartile 1 is the poorest and quartile 4 is the wealthiest. When I looked at these findings more closely, I found that most urban participants with cancer were from the higher SES quartiles and most rural participants with cancer were from the middle SES quartiles.
The graph below shows the SES quartiles for rural and urban participants with breast cancer. If we look at the top line of the graph, we can see how many participants were in the quartile 4, the highest SES group. Among rural participants with breast cancer, only 23% were in the highest SES quartile. In contrast, more than half (54%) of all urban participants with breast cancer were in the highest SES quartile.
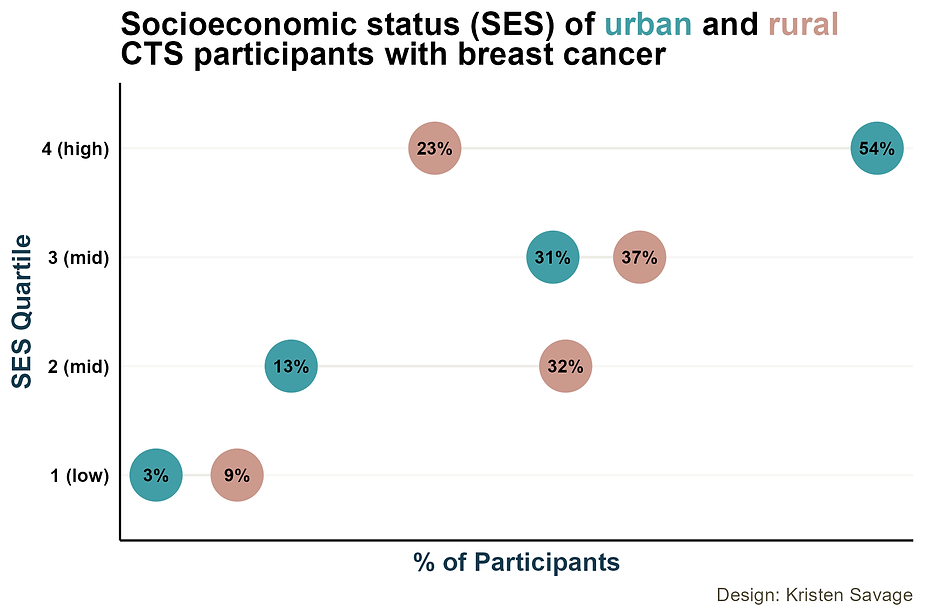
Figure 3: Socioeconomic statuses (SES) of urban and rural CTS participants with breast cancer graph. Design: Kristen Savage
Future Goals
Cancer is the second most common cause of death in the CTS. It is also a leading cause of death in the United States. Identifying modifiable risk factors—meaning risk factors that can be changed— can guide public health programs aimed at reducing disparities.
This project provides a basis for further exploring the differences in lifestyle factors between urban and rural participants who have had cancer. Future studies could compare the socioeconomic status of urban and rural cancer patients to the socioeconomic status of all study participants to see if urban-rural disparities exist generally in the CTS or if they are cancer specific.
In the literature I reviewed, rural and urban definitions varied by study. This makes it difficult to compare research on urban-rural cancer differences. It would be helpful to agree on consistent definitions of urban and rural, as well as to recognize that urban and rural areas exist on a continuum and do not necessarily fit into strict categories.
About the Author
 Jean Rinkowski is a Physical Therapist and a current student in the Population and
Health Sciences online MPH program. Her academic focus areas are epidemiology, data
analysis, and health policy. During her graduate studies, she’s earned a graduate
certificate in Applied Epidemiology and is currently working toward a second graduate certificate in Tools in Health Policy Assessment. She is passionate about using data to identify disparities, enhance health policies,
and improve health outcomes for entire populations.
Jean Rinkowski is a Physical Therapist and a current student in the Population and
Health Sciences online MPH program. Her academic focus areas are epidemiology, data
analysis, and health policy. During her graduate studies, she’s earned a graduate
certificate in Applied Epidemiology and is currently working toward a second graduate certificate in Tools in Health Policy Assessment. She is passionate about using data to identify disparities, enhance health policies,
and improve health outcomes for entire populations.
"Completing my Applied Practicum Experience with the CTS team has involved writing code, interpreting the findings, and identifying potential areas for further research. I’m incredibly thankful to the CTS team for sharing their expertise and guidance during this experience."